KPI Command Center
A Google Apps Script–powered KPI dashboard and reporting system that turns raw support case data into an executive dashboard and team performance view — built to replace the kind of manual SLA reporting I used to do by hand.
📊 Project Summary
- Built entirely in Google Sheets + Apps Script — no external tools or licenses required, so any team can drop it in and run it.
- One function call (
buildKPIDashboard()) takes raw case data through a Setup → Raw Data → Clean Data pipeline and outputs a finished Executive Dashboard and Team Metrics view. - Auto-calculates SLA %, average and typical response/resolution hours, and case volume by status, priority, and account.
- Team Metrics tab breaks performance down by rep — cases handled, SLA %, and response time comparisons — for 1:1s and team reviews.
- Config tab keeps SLA thresholds and business rules editable without touching the underlying script.
🧰 Tools Used
- Google Apps Script (JavaScript)
- Google Sheets (formulas, charts, conditional formatting)
- Data cleaning & transformation logic
📷 Dashboard Screenshots
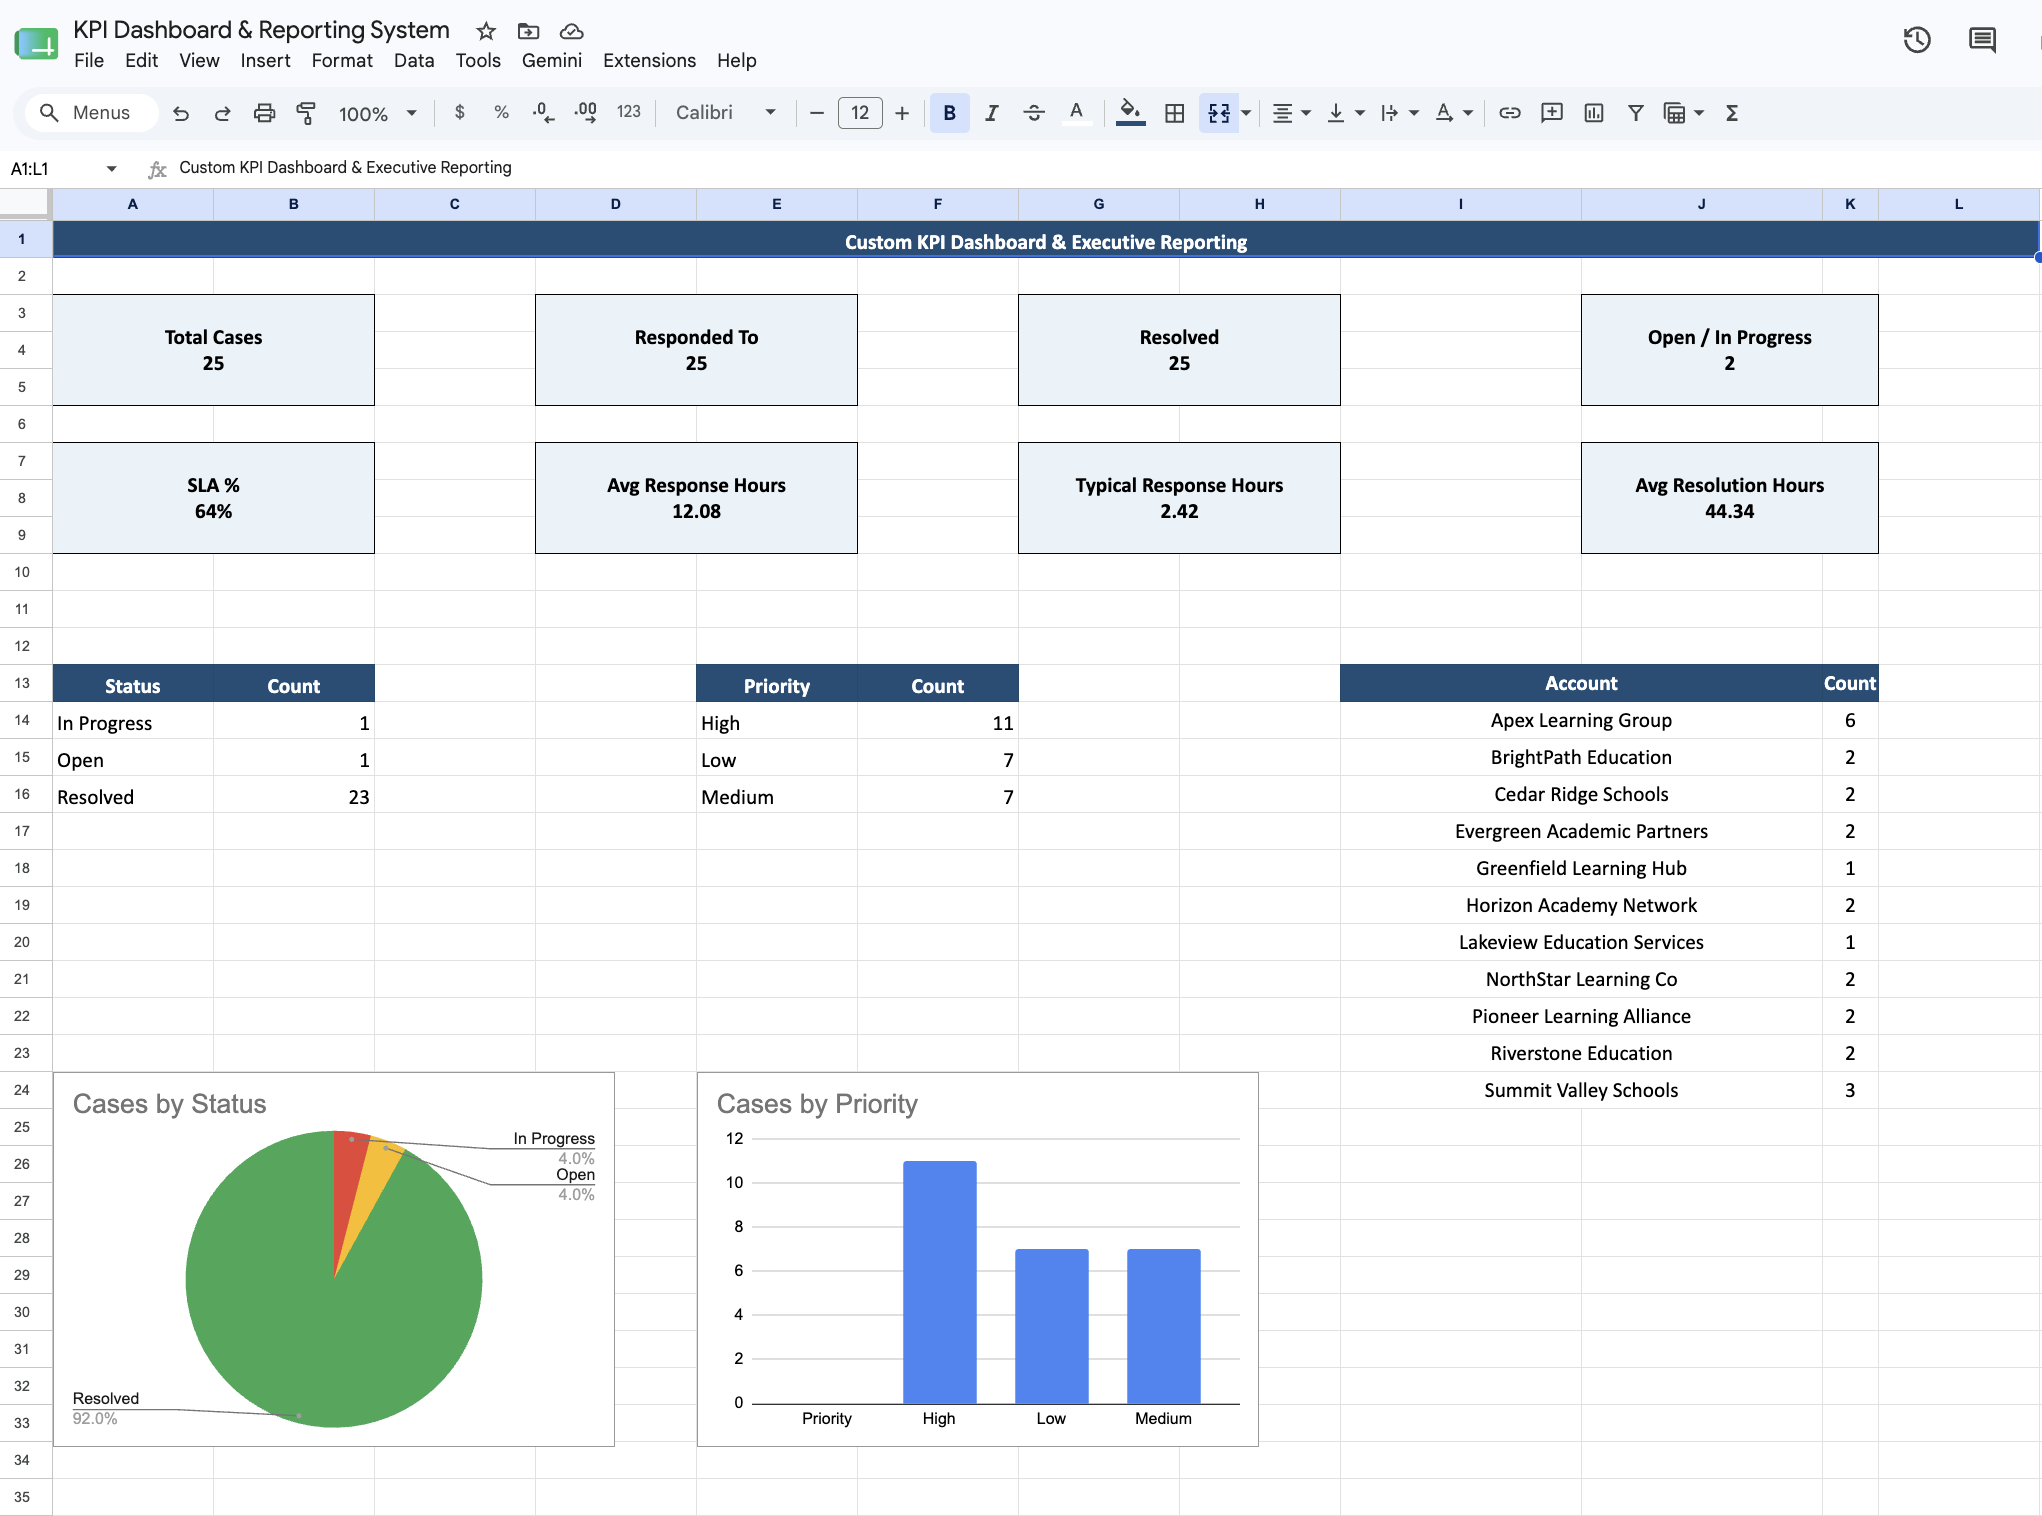
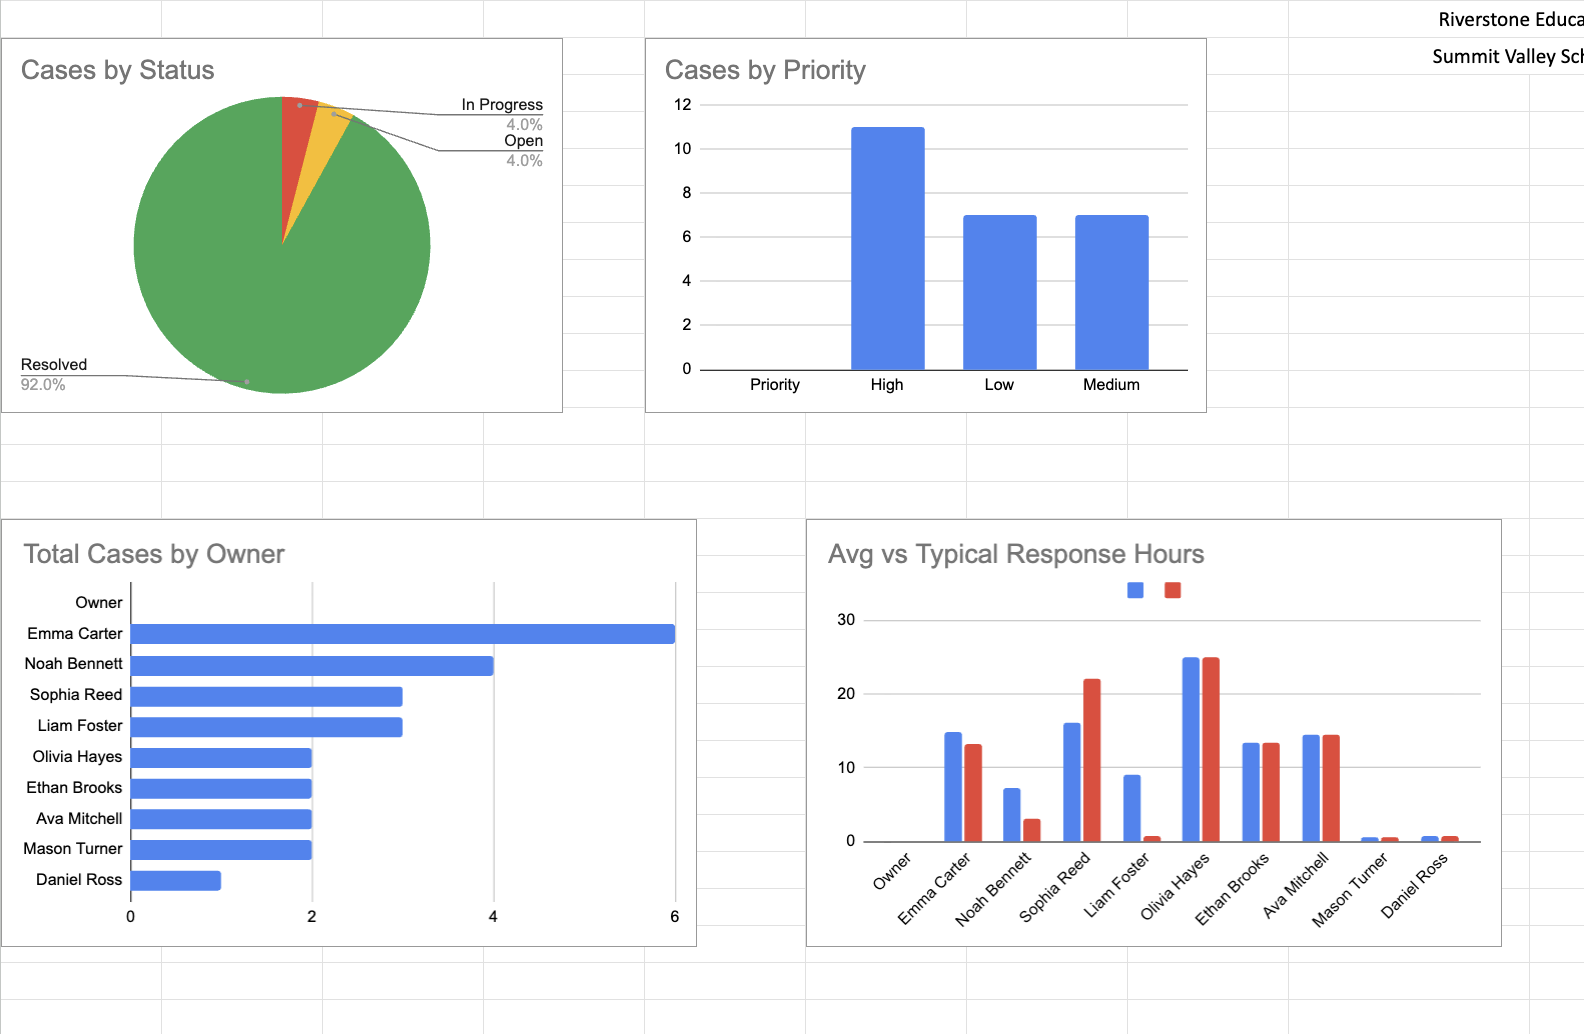
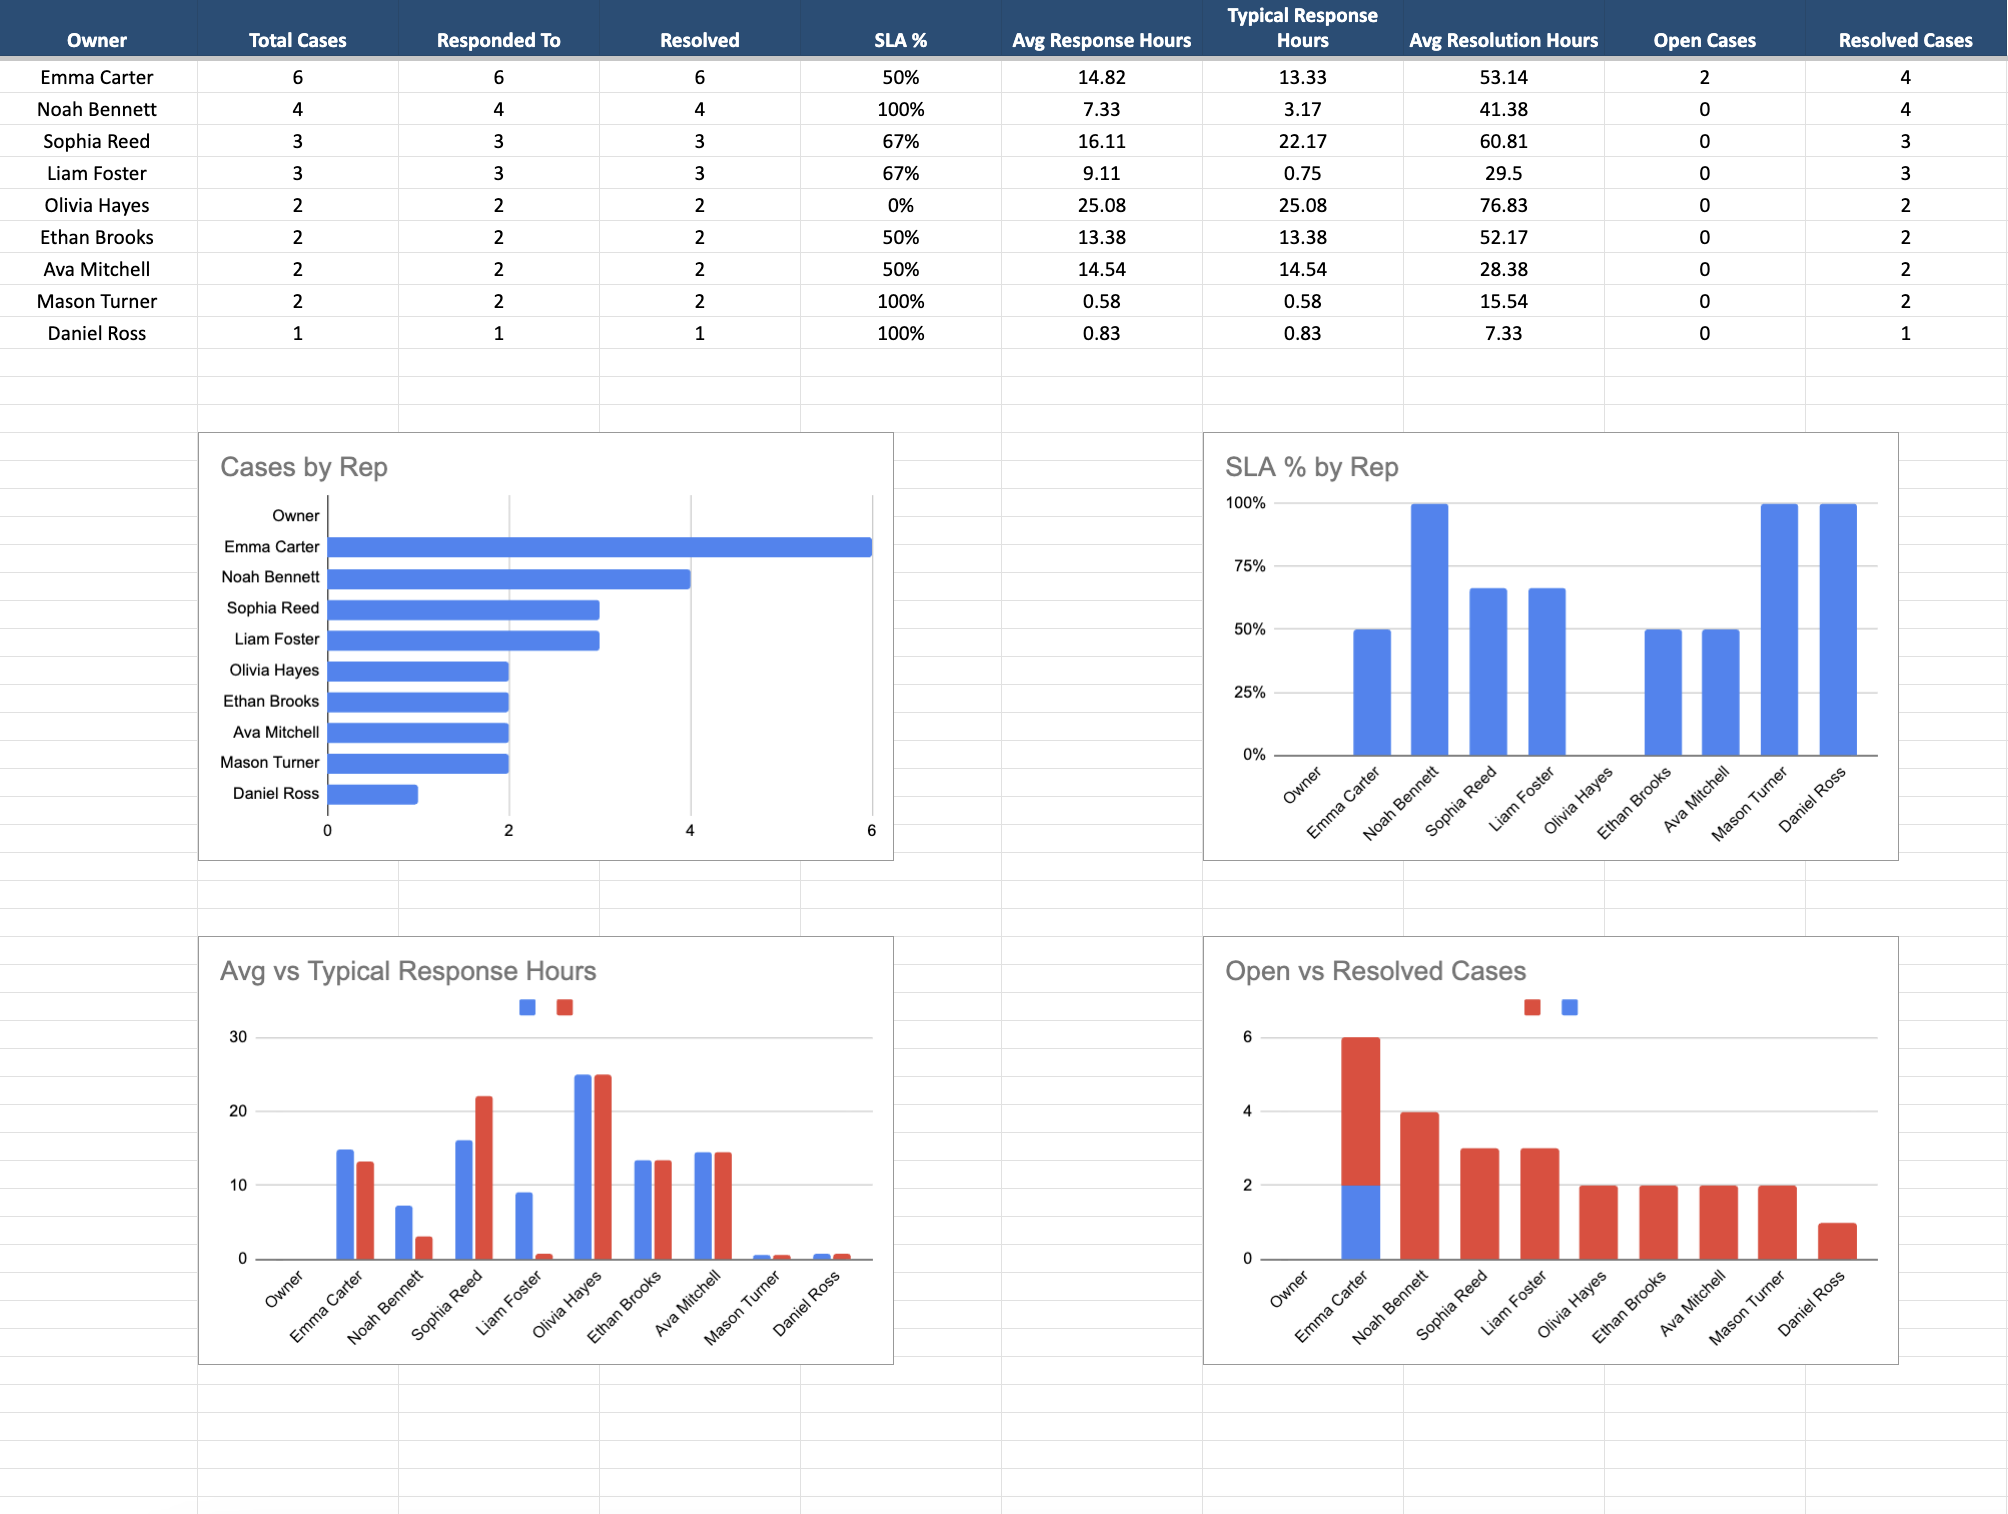
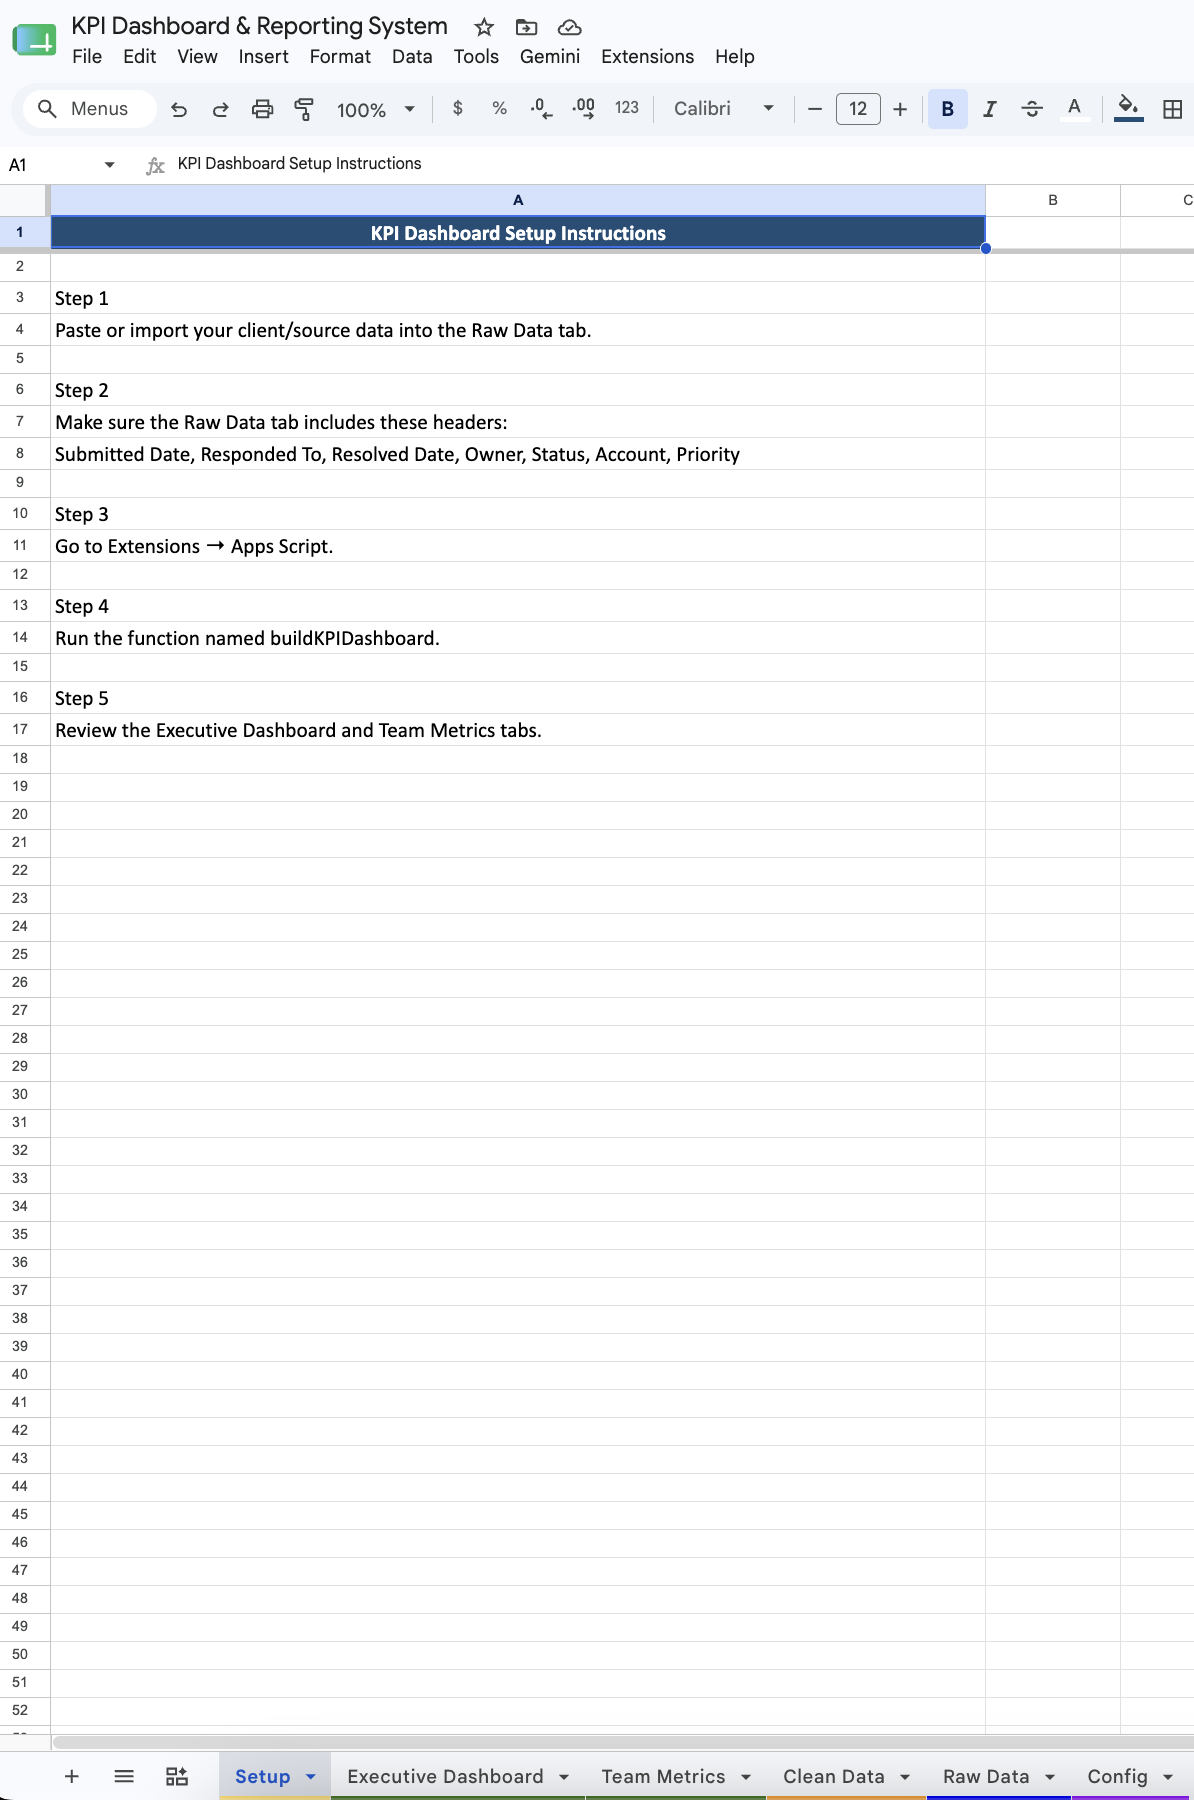
📁 Files
Download the Apps Script source, the setup guide, or the sample dataset used to build the dashboard above.