Creator Analytics Dashboard
A Streamlit dashboard that pulls public YouTube channel data via the YouTube Data API v3 and visualizes creator performance side by side — enter up to four channel handles and compare subscribers, views, upload cadence, and engagement in one view.
📊 Project Summary
- Pulls live channel and video stats for up to four YouTube channels at once via the YouTube Data API v3 — just a handle or channel ID and an API key.
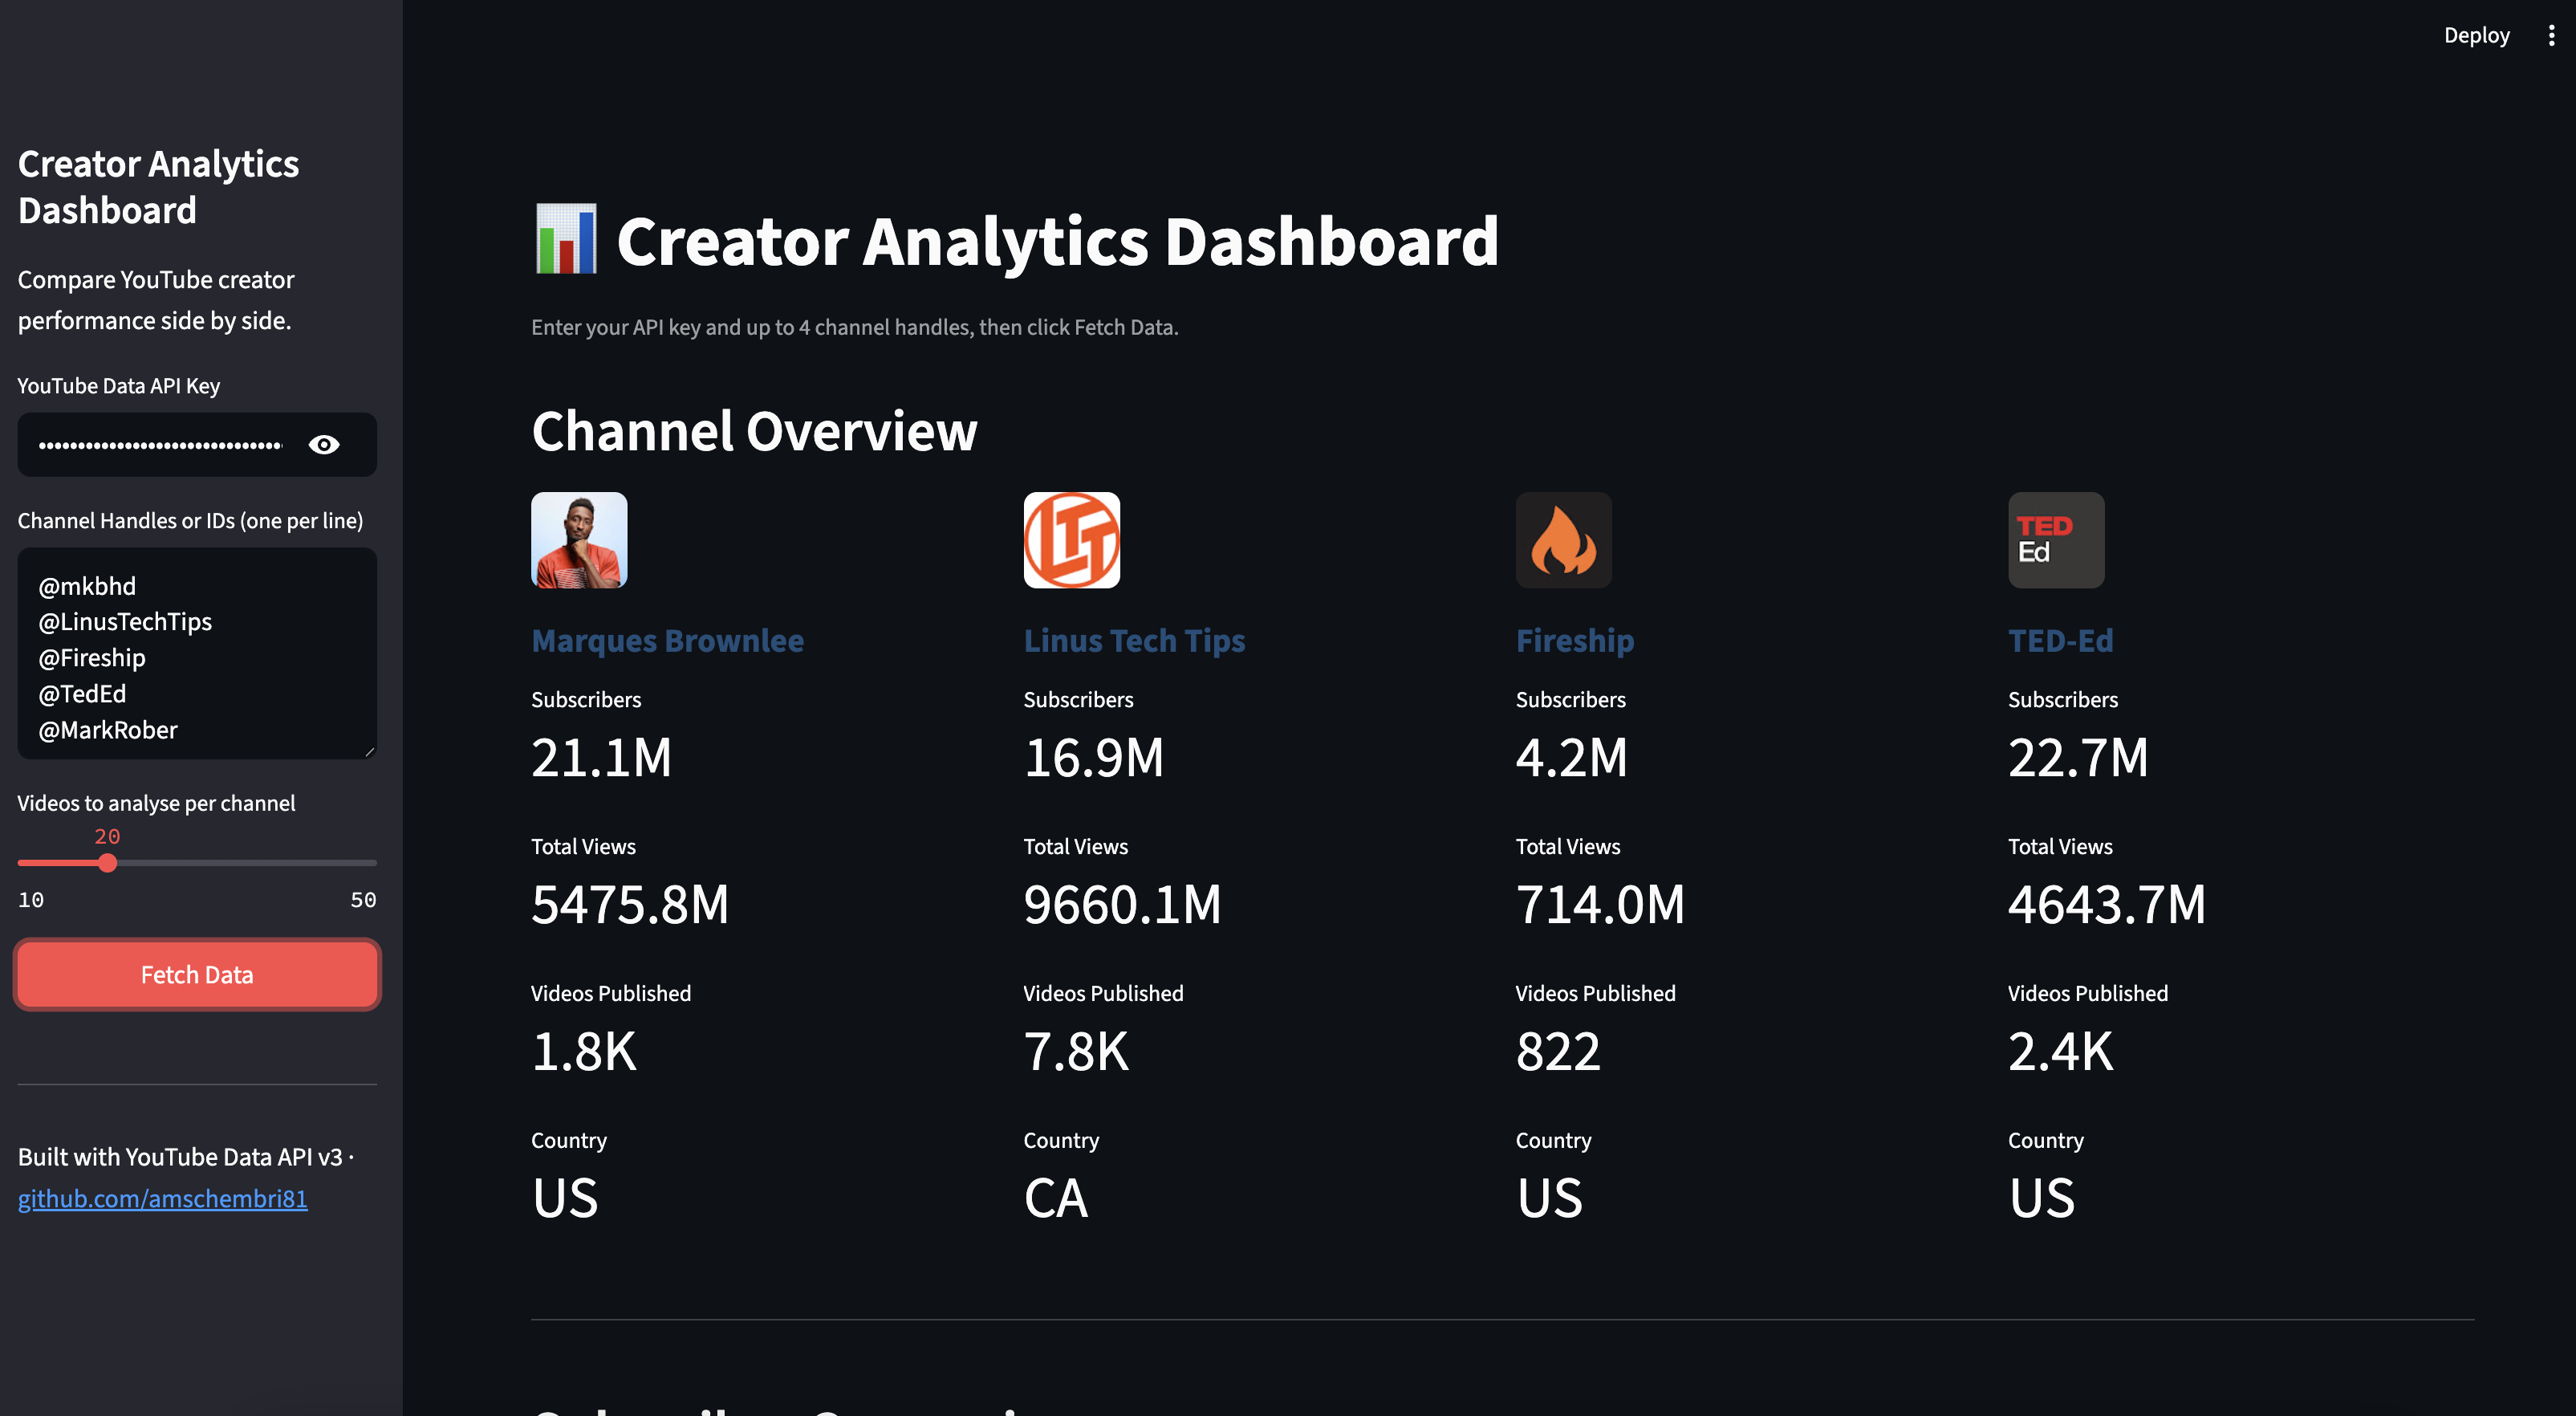
- Channel overview cards surface subscribers, total views, video count, and country for each channel at a glance.
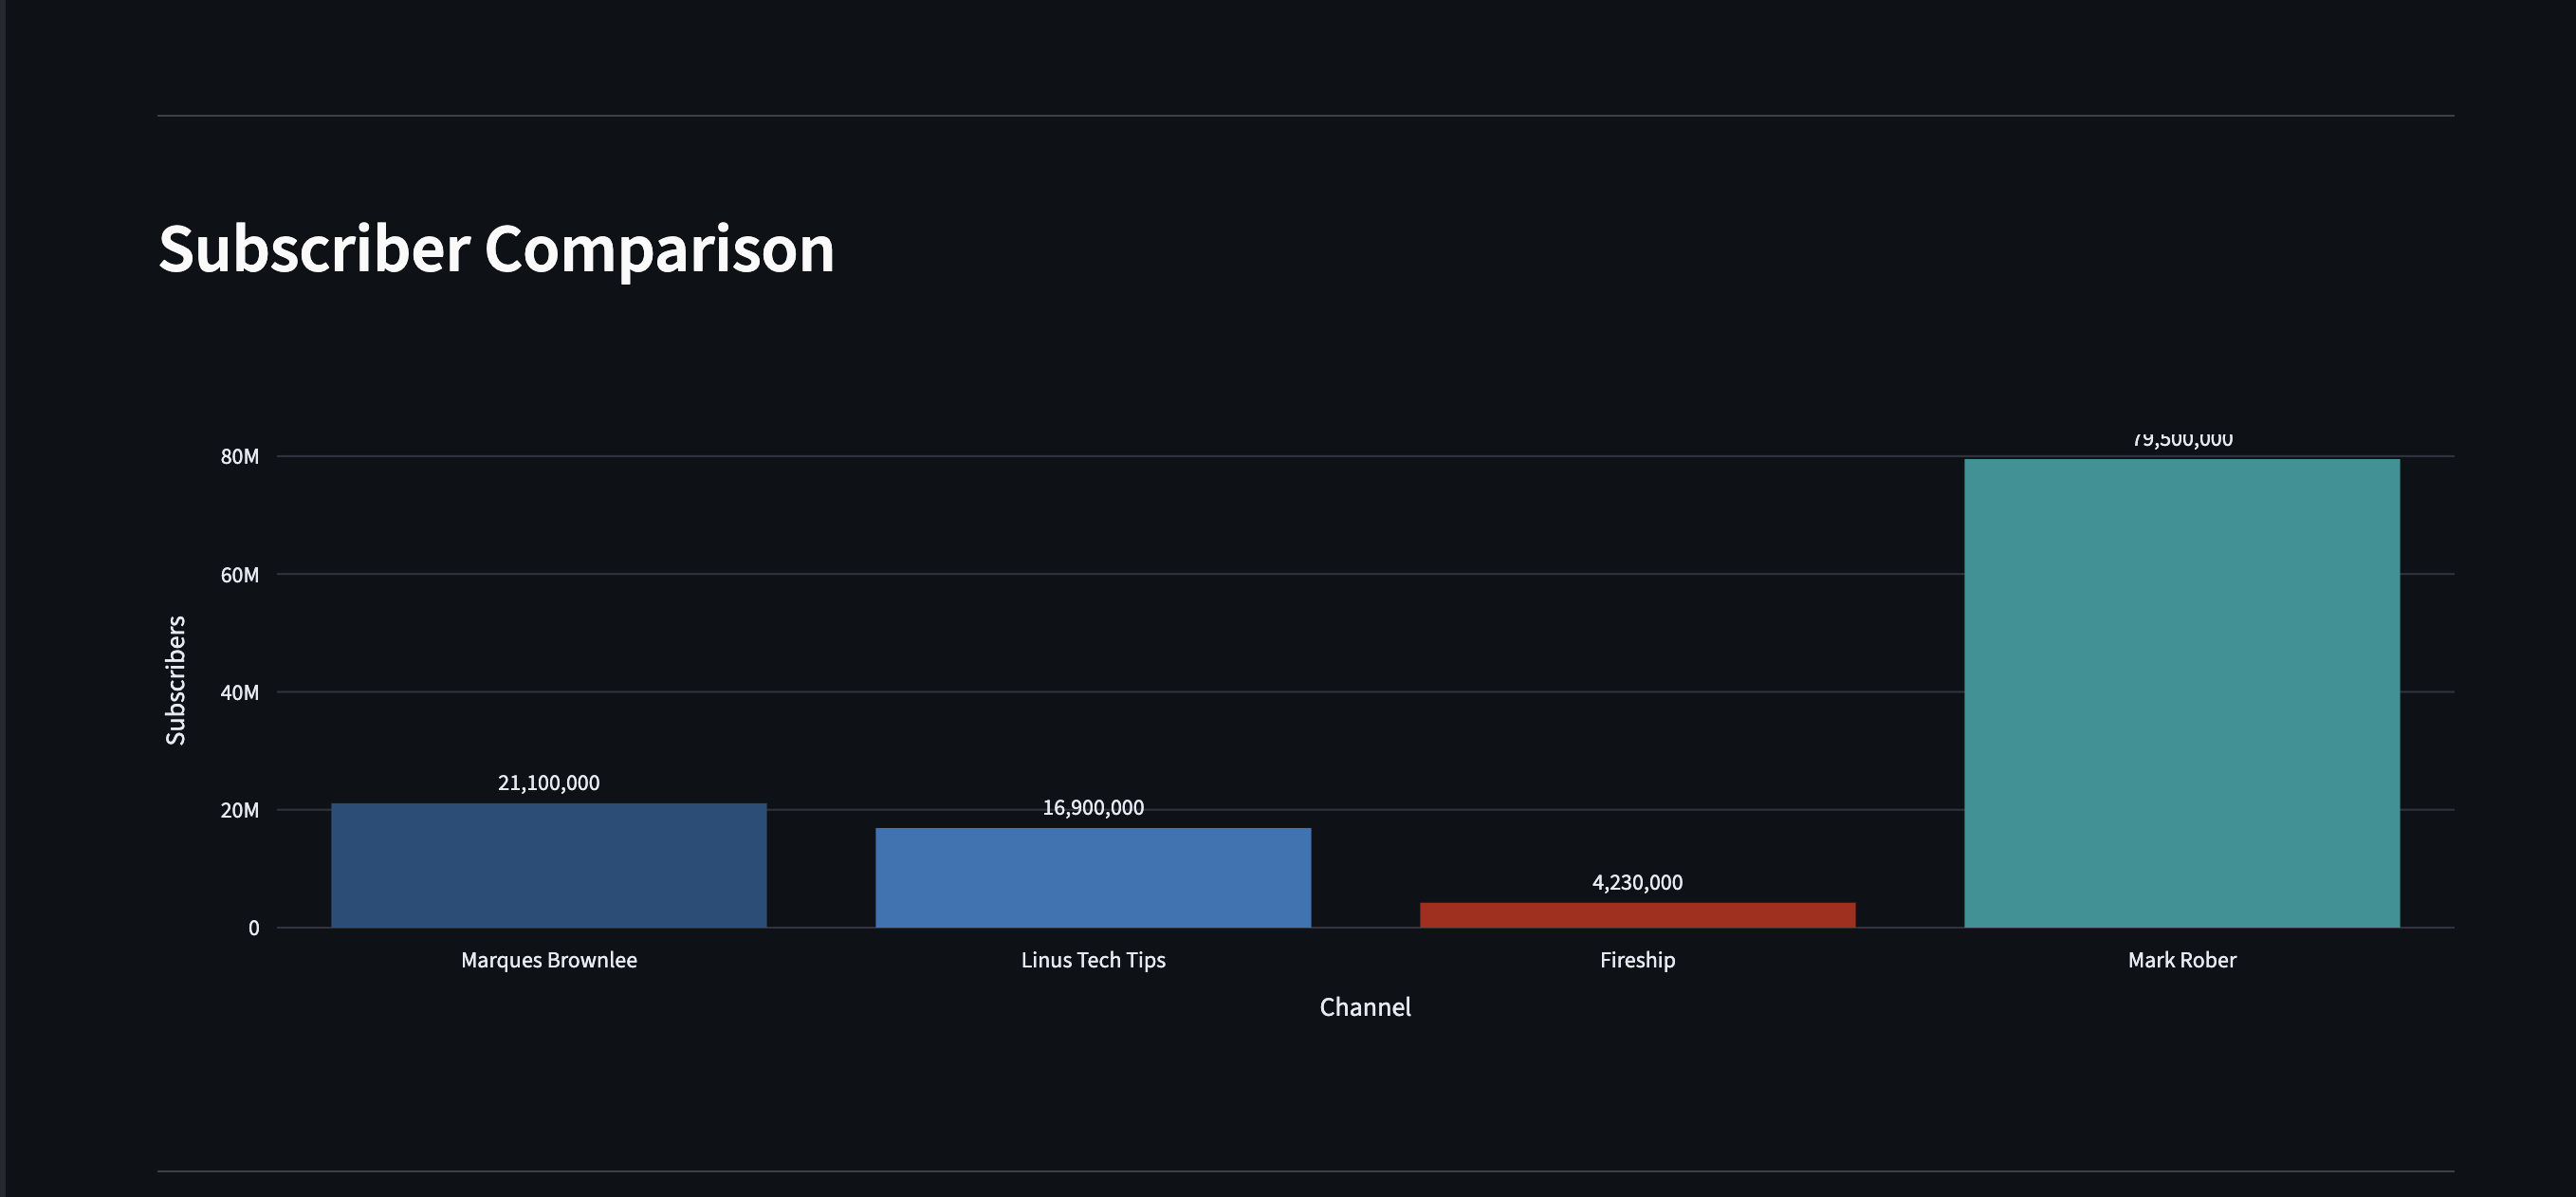
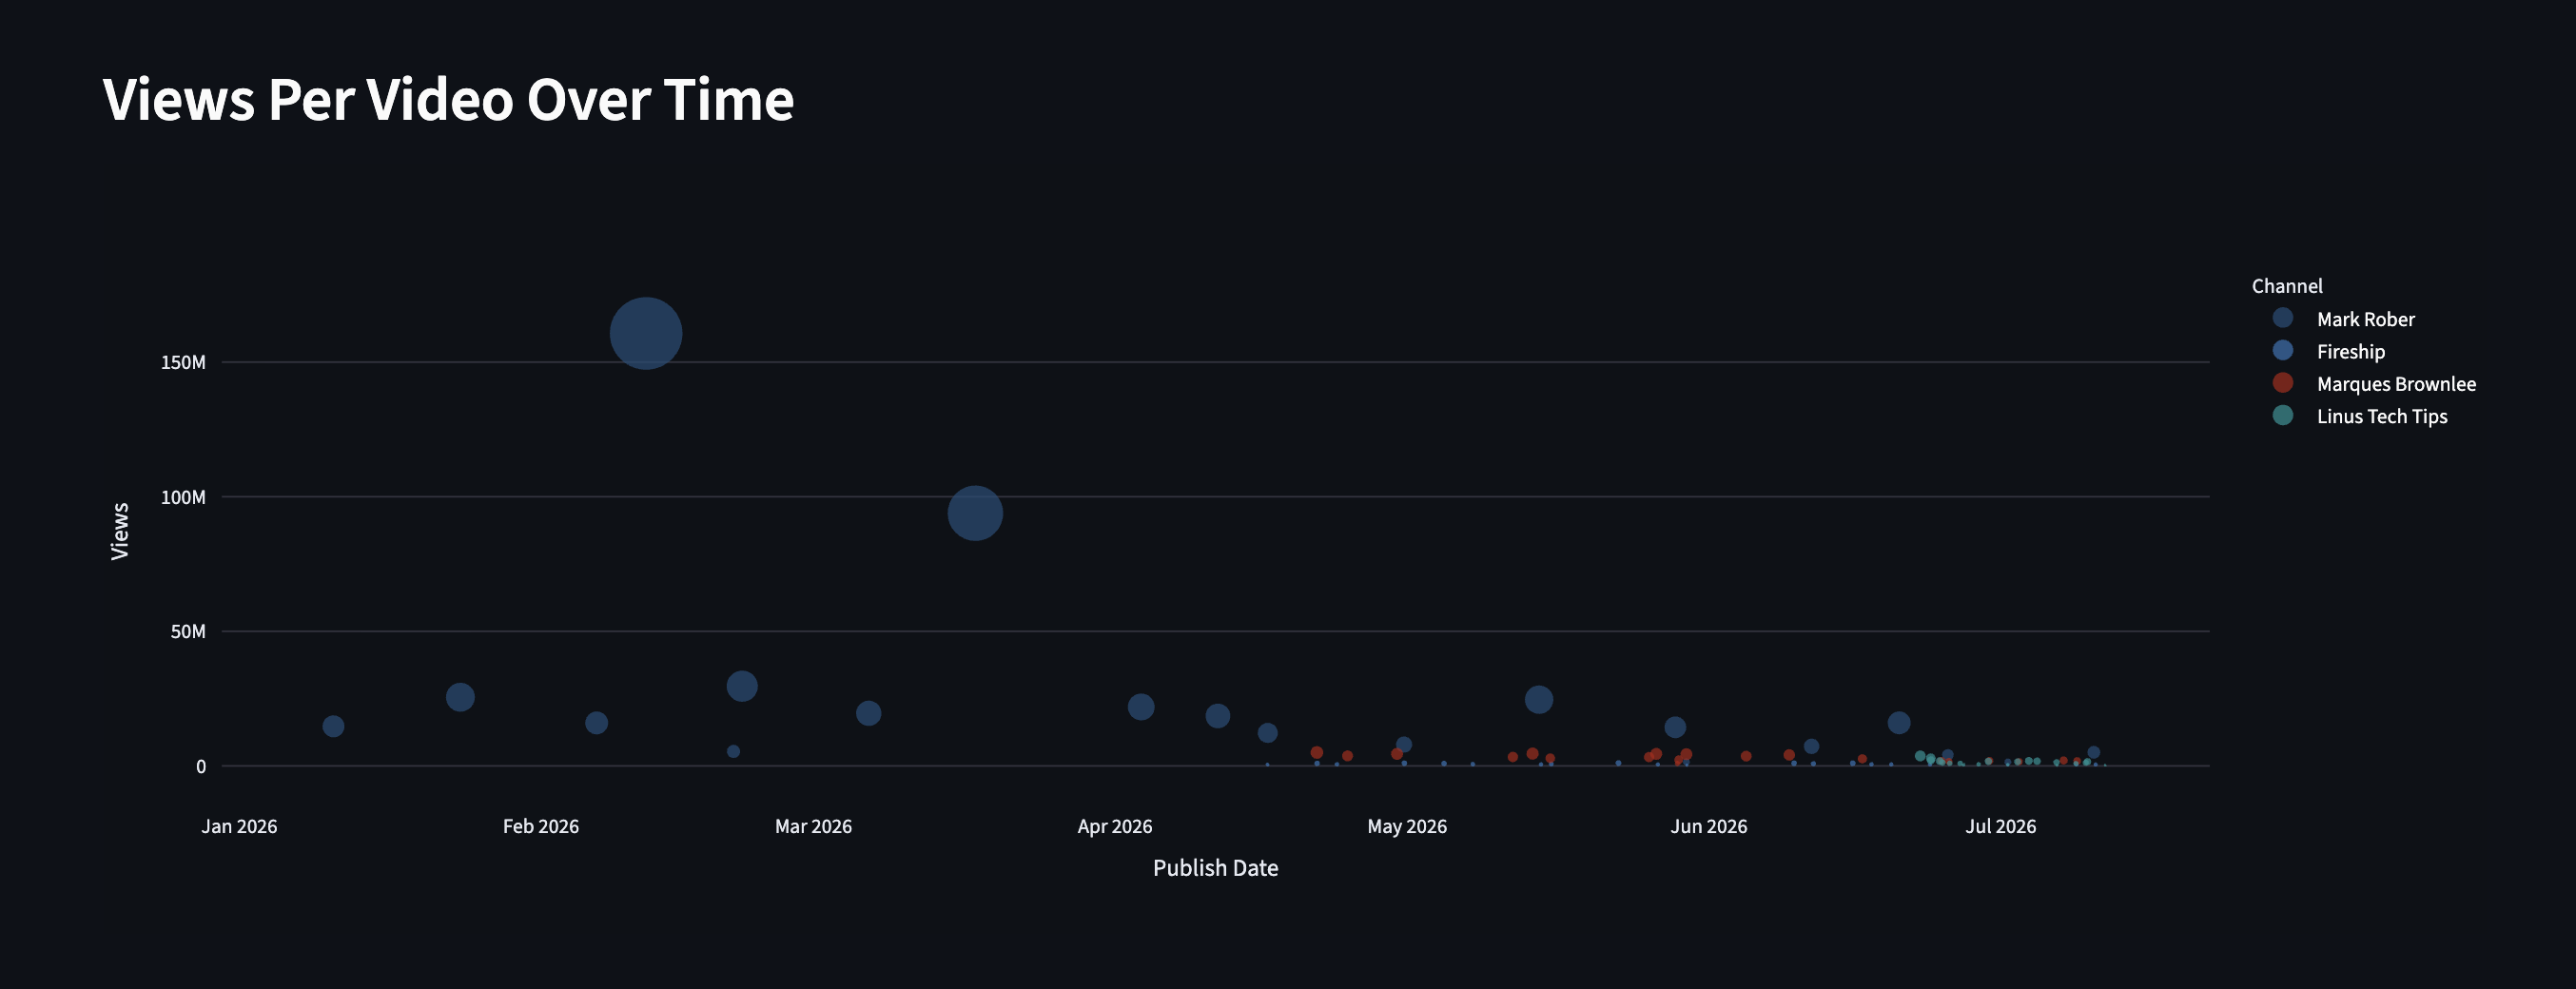
- Subscriber comparison bar chart and a views-per-video scatter plot plot channel size against video-level performance over time.
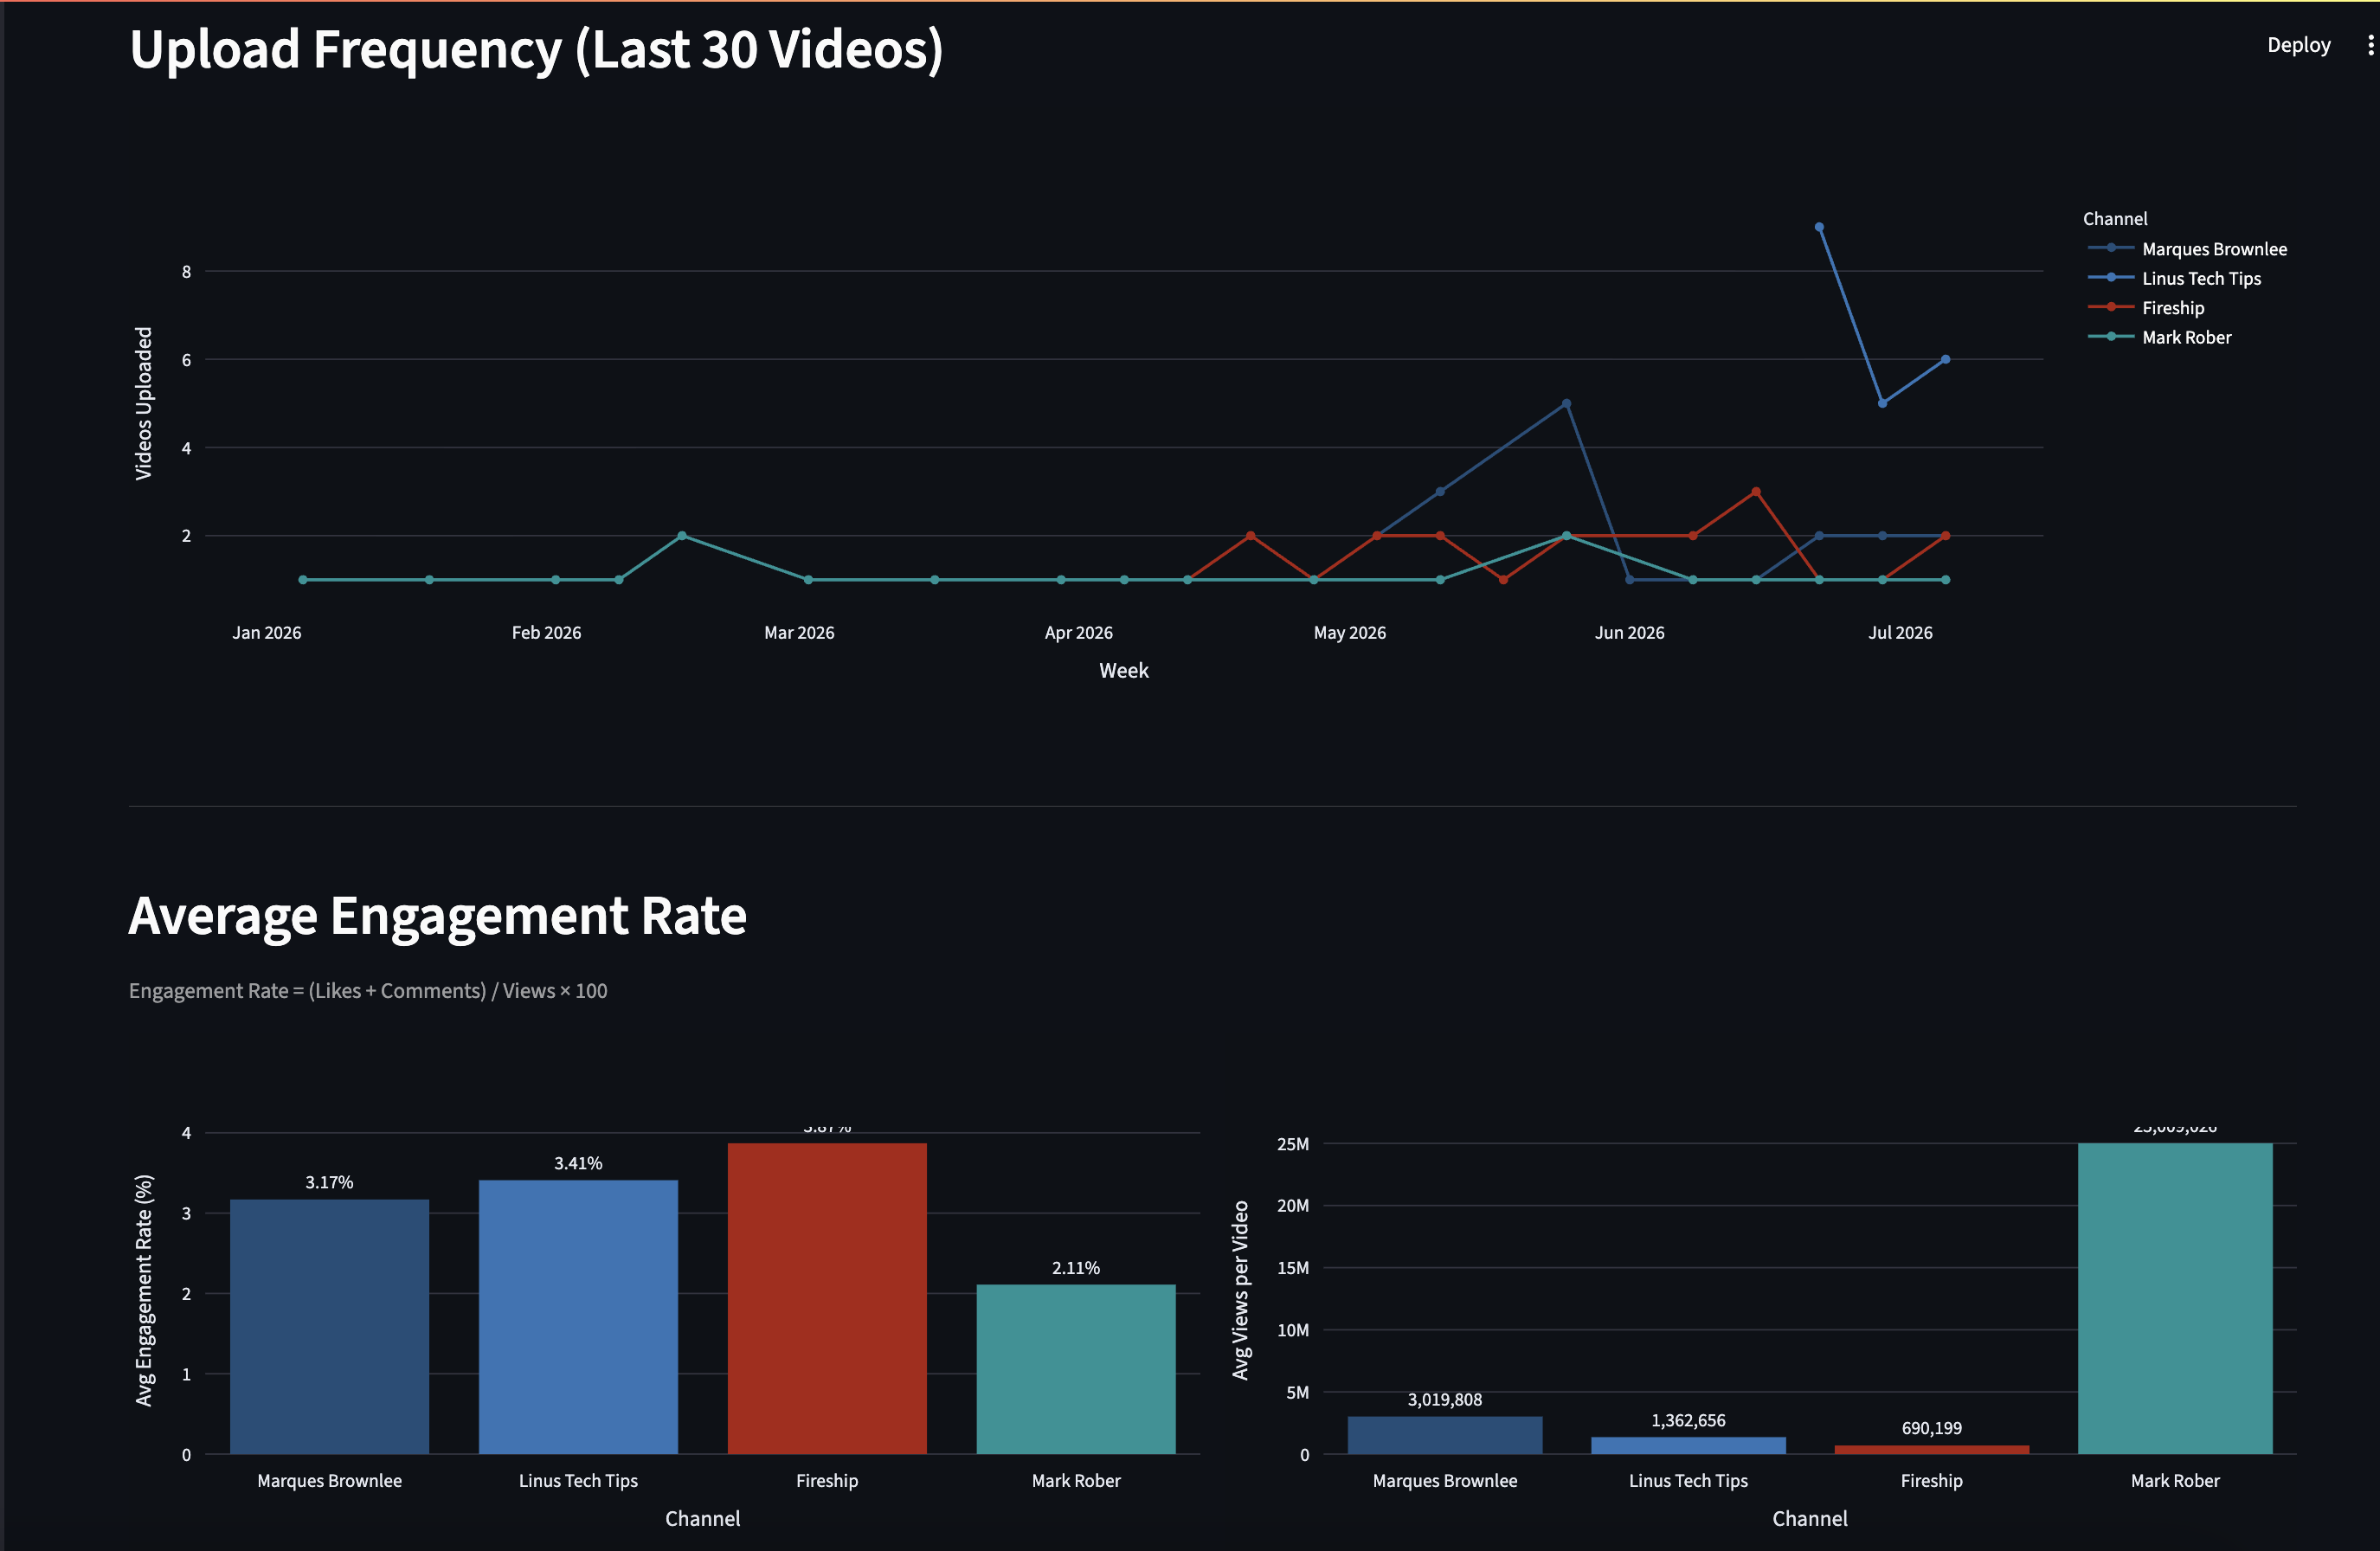
- Weekly upload frequency chart tracks publishing cadence per channel, alongside average engagement rate and average views per video.
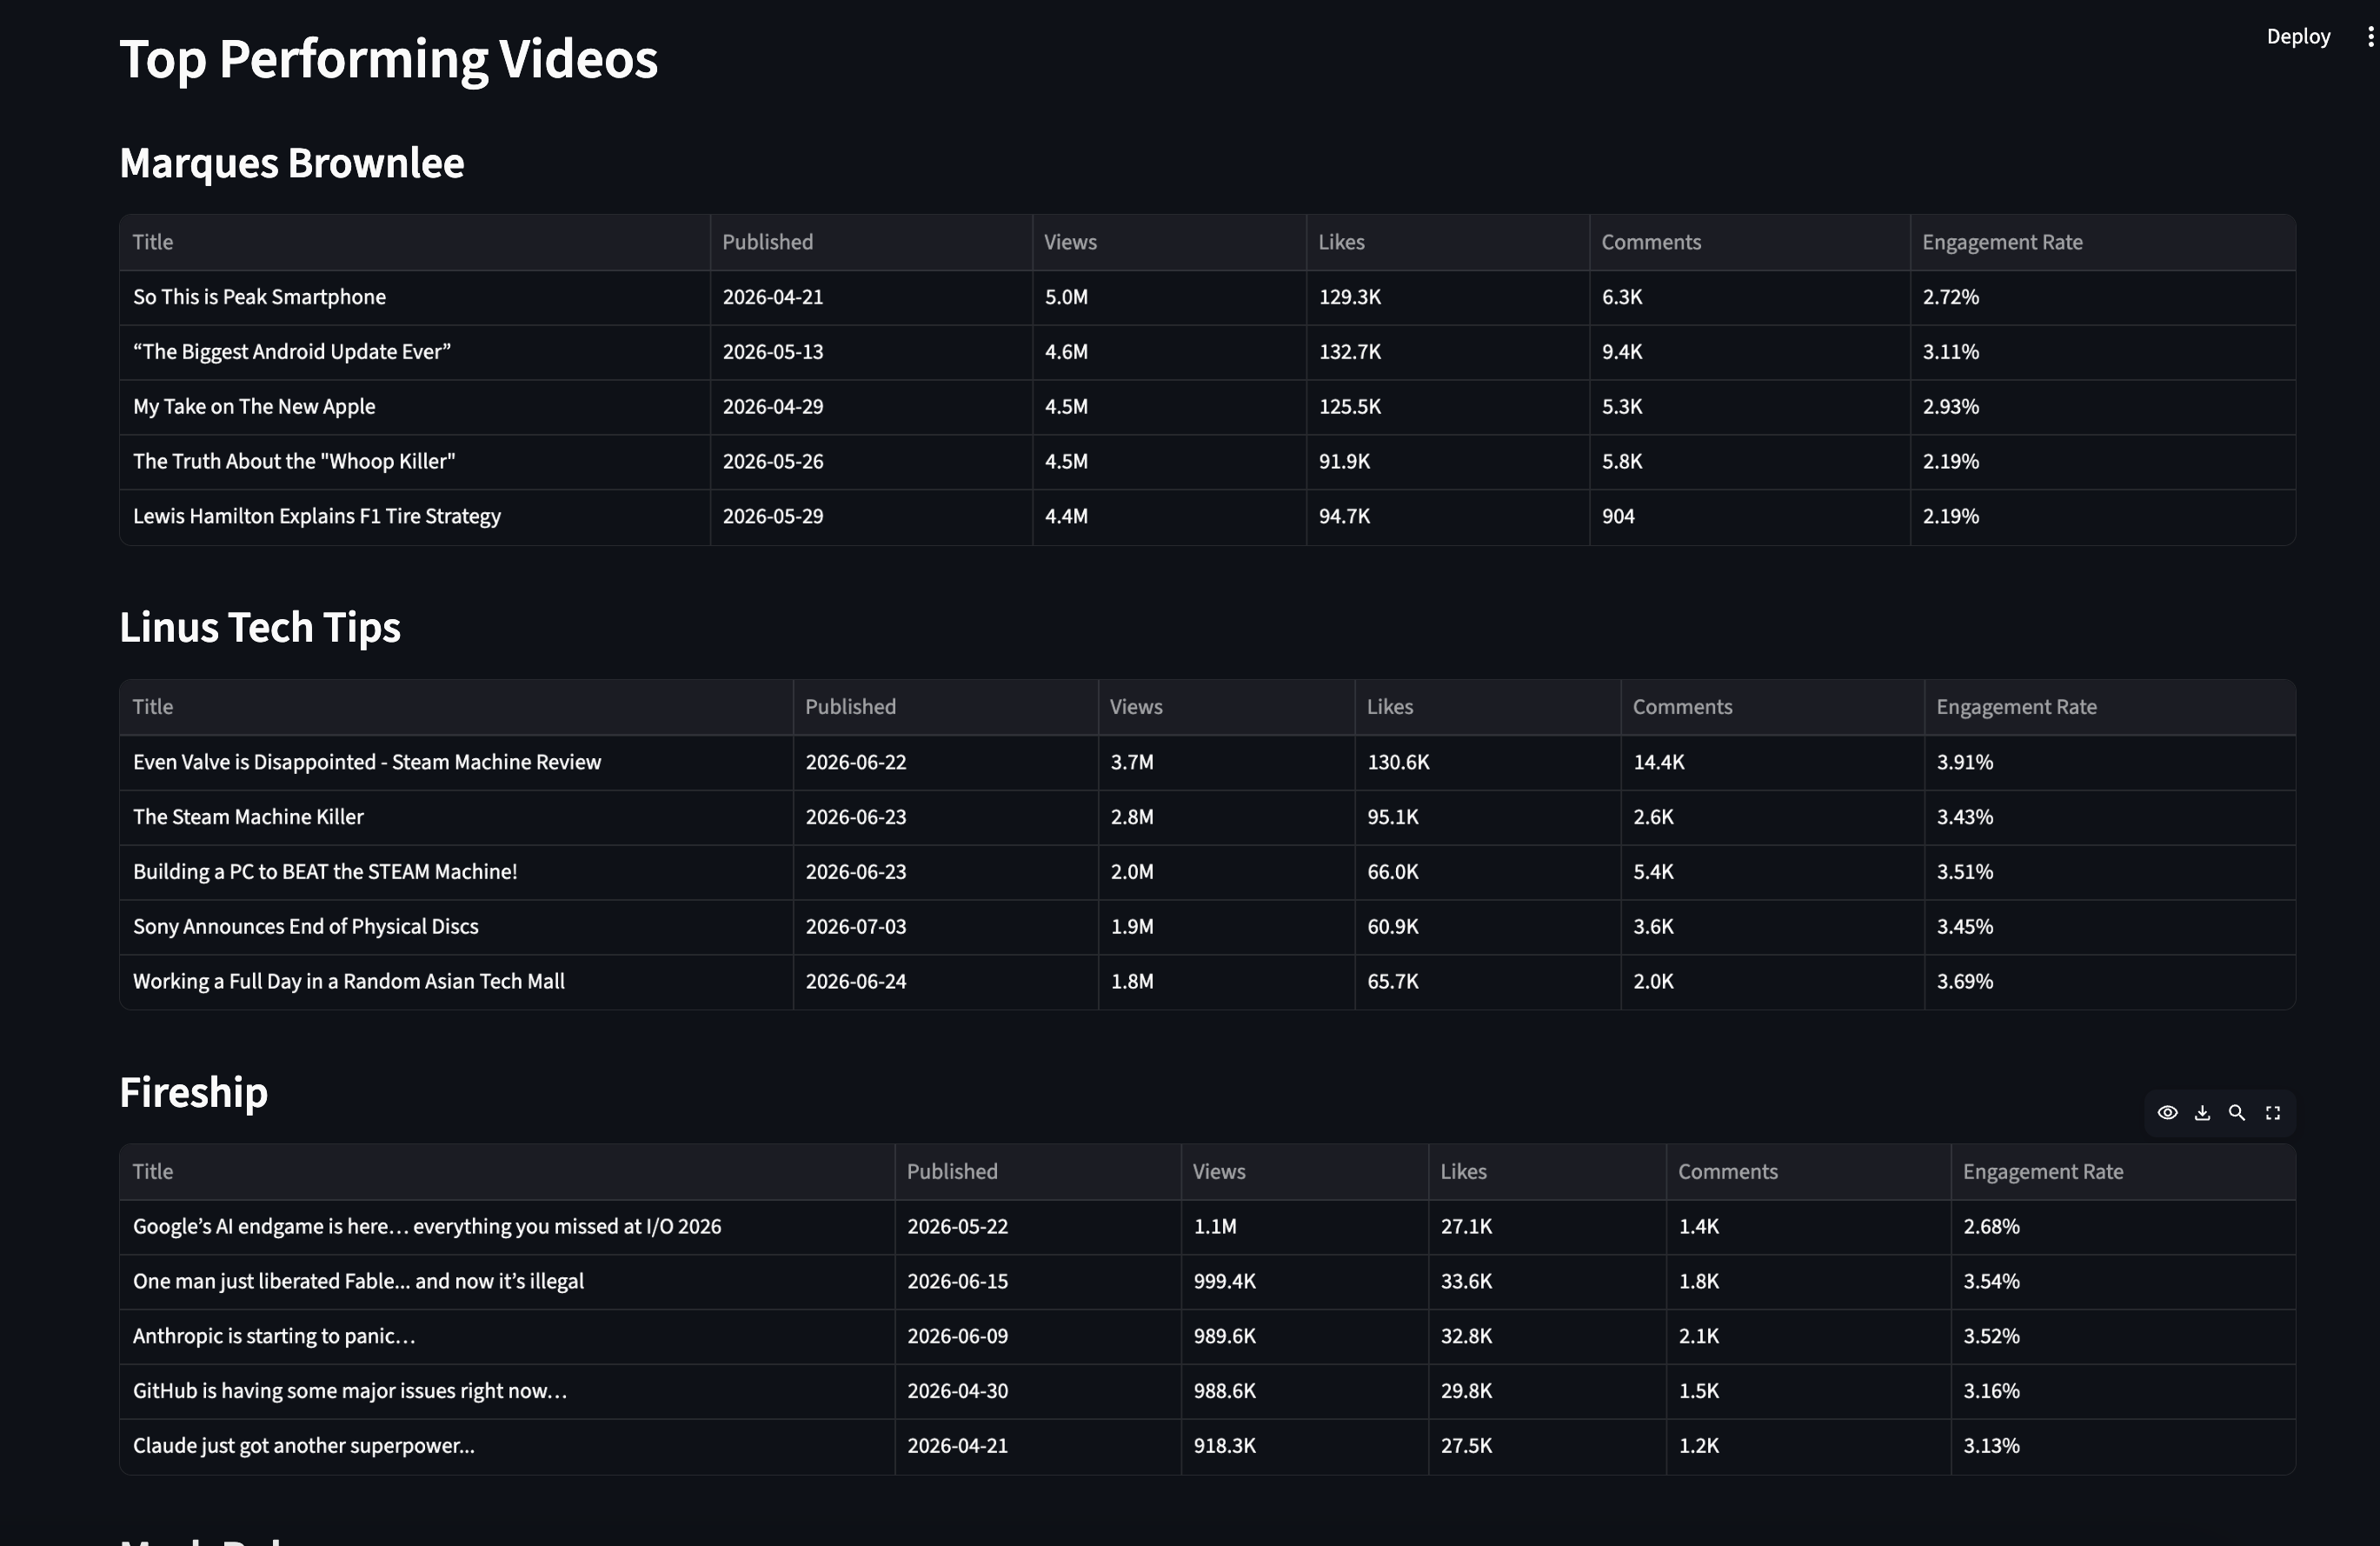
- Top 5 performing videos table per channel, ranked by views with likes, comments, and engagement rate.
🧰 Tools Used
- Python, Streamlit — interactive dashboard app
- YouTube Data API v3 — live channel and video data
- Pandas — data wrangling and aggregation
- Plotly — charts and visualizations
📷 Dashboard Screenshots